What is the PAPRIKA method?

Award-winning, patented technology
1000minds’ “secret spice” is the PAPRIKA method. Invented by 1000minds’ founders, Paul Hansen and Franz Ombler, PAPRIKA is a method for helping organizations, individuals and groups to discover what’s important and make decisions consistently, fairly and transparently.
The PAPRIKA method was designed to be as user-friendly as possible, as well as scientifically valid and reliable. For reasons that will become clear later, “PAPRIKA” is an acronym for the method’s full name: Potentially All Pairwise RanKings of all possible Alternatives (PAPRIKA).
PAPRIKA has been patented and recognized in 18 innovation awards. The Consensus Software Awards (sponsored by IBM and Microsoft), for example, praised 1000minds for having “blended an innovative algorithm with a simple user interface to produce a tool of great power and sheer elegance.”
As well as business, government and nonprofit applications, PAPRIKA is used for research and teaching at 870+ universities and other research organizations worldwide. Since 2006, 420+ peer-reviewed articles or abstracts about a wide variety of PAPRIKA-related research projects have been published.
The first part of this article is a gentle introduction to PAPRIKA, followed by more detailed, though still non-technical, information and, for readers interested in other methods, comparisons with the Analytic Hierarchy Process (AHP) and statistical estimation of logit choice models. PAPRIKA’s technical details are available in Hansen and Ombler (2008).
PAPRIKA method
PAPRIKA involves the decision-maker – e.g. you! – answering a series of simple questions based on choosing between two hypothetical alternatives defined on just two criteria or attributes at a time.
In each question, the levels on the two criteria or attributes – hereinafter, for simplicity, mostly referred to as “criteria” – are specified so that there is a trade-off between the criteria.
Two examples of PAPRIKA’s trade-off questions appear below. Figure 1 is in the context of Multi-Criteria Decision Analysis (MCDA), also known as Multi-Criteria Decision-Making (MCDM). Figure 2 is for conjoint analysis, also known as a discrete choice experiment (DCE). 1000minds is the only software in the world combining the power of both decision-making and conjoint analysis in one beautiful package.
How you answer PAPRIKA’s trade-off questions – by choosing one of the alternatives over the other, or “they are equal” – depends on how you feel about the relative importance of the criteria in each question, based on your expertise and judgment.
PAPRIKA’s questions are repeated with different pairs of hypothetical alternatives defined on different combinations of the criteria for your application until your preferences are captured.
Depending on the application, PAPRIKA’s questions can be answered by individuals working on a decision on their own; or by groups voting on each question in turn in pursuit of consensus; or by 1000s of participants in a 1000minds preferences survey (especially useful for conjoint analysis and DCE).
PAPRIKA’s trade-off questions
PAPRIKA’s trade-off questions (see Figures 1 and 2 above again) have these three fundamental characteristics in all applications of the method:
- Each question involves a trade-off between the two criteria defining the two hypothetical alternatives you are asked to choose between. Which alternative you choose depends on how you feel about the relative importance of the two criteria. You may also rate the alternatives equally.
- In each question, any other criteria included in the application but not appearing in the question – e.g. “engine size”, “safety features”, etc for Figure 2’s application – are implicitly treated as the same for the alternatives in the question: i.e. “all else being equal”. These other criteria will appear, two at a time, in other trade-off questions asked by PAPRIKA.
- The two alternatives in each question – e.g. “projects” or “cars” in Figures 1 and 2 above – are hypothetical, or imaginary, instead of actual alternatives you are considering. By choosing between hypothetical alternatives, you are expressing your preferences.
Easiest questions possible
Compared to other methods, the advantage of PAPRIKA’s questions – e.g. Figures 1 and 2 above – is that they involve just two alternatives differentiated on two criteria at a time. These are the easiest possible questions involving trade-offs to think about. Therefore, you can have confidence in the accuracy of your answers.
Such simple questions are repeated with different pairs of hypothetical alternatives, always involving trade-offs between different combinations of the criteria, two at a time.
When you have finished answering questions with just two criteria – typically, a fast process – it’s possible to proceed to the “next level of decision-making” by answering questions with three criteria, and then four, and so on, up to the number of criteria for your application.
However, answering questions with just two or three criteria is usually sufficient for revealing your preferences accurately, so that for most applications you can stop after that.
From your answers, PAPRIKA uses mathematical techniques (explained later) to codify how you feel about the relative importance of the criteria as weights – often referred to as “preference values” or “utilities”, also known as “part-worths”. These weights are used by 1000minds to rank alternatives you are considering.
Additive models and accuracy
As for most methods for decision-making and conjoint analysis, PAPRIKA is based on what are known in the academic literature as additive “multi-criteria value models” or “multi-attribute value models”. Other, more common, names include “additive”, “weighted-sum”, “linear”, “scoring”, “point-count” or “points” models or systems.
As indicated by these names, the defining characteristic of such models is that, after each alternative has been rated on the levels for the criteria, its “total score” is calculated by summing the corresponding weights. This rating and scoring exercise results in a total score for each alternative – usually in the range of 0-100 points – by which the alternatives are ranked.
As demonstrated in many studies across many different areas, additive models have been universally found to be more accurate than unaided, intuitive decision-making (Hastie and Dawes 2010; Kahneman 2011; Kahneman, Sibony & Sunstein 2021). The accuracy of additive models – sometimes also referred to as “equations” or “formulas” – often comes as a surprising revelation to decision-makers.
For example, according to Hastie and Dawes (2010, p. 52), additive models are:
surprisingly successful in many applications. We say ‘surprisingly’, because many judges claim that their mental processes are much more complex than the linear summary equations would suggest – although empirically, the equation does a remarkably good job of ‘capturing’ their judgment habits.
According to Kahneman (2011, p. 225):
The research suggests a surprising conclusion: to maximize predictive accuracy, final decisions should be left to formulas, especially in low-validity environments.
Decision-making environments characterized as “low validity” are ones in which valid cues for accurately predicting the outcome of interest are rare or non-existent, in contrast to high-validity environments in which such cues are relatively abundant.
Adaptive conjoint analysis
PAPRIKA is also recognized as a type of adaptive conjoint analysis because the method is continually adapting as it presents you with your own personal sequence of trade-off questions to answer (by making choices).
Each time you answer a question, PAPRIKA, in effect, “thinks” for a split second and then, based on your earlier answers, it selects your next question. When you answer that question, PAPRIKA thinks again and selects another question; and then another, and another, and so on until you are finished.
PAPRIKA’s objective as it adaptively selects your questions is to minimize the number you are required to answer to arrive at all pairwise rankings of all hypothetically possible alternatives defined on two criteria at a time (where, in effect, the other criteria for your application are treated as the same in each question).
It’s possible – though usually not necessary – to go to PAPRIKA’s “next level of decision-making” and answer trade-off questions with more than just two criteria: three criteria, and then four, and so on, up to the number of criteria in your application.
If you decide to answer these higher-level questions, as it did for the two-criteria questions, PAPRIKA’s adaptive process ensures all pairwise rankings of all hypothetically possible alternatives defined at each higher level are determined as a result of the questions you answer (again, the minimum number possible).
Thus, because of this capacity for identifying all such pairwise rankings, the method is known as the Potentially All Pairwise RanKings of all possible Alternatives method, or by its “PAPRIKA” acronym: the PAPRIKA method.
How many questions?
How many trade-off questions with just two criteria at a time – sufficient for most applications – do you need to answer?
The number depends on the number of attributes and levels for your application and how you answer them.
For example, with four attributes and three or four levels for each attribute, you can expect PAPRIKA to ask you approximately 25 questions – taking most people less than 10 minutes to answer.
No “design” issues
A major advantage of PAPRIKA’s adaptivity is that when the administrators of a conjoint analysis survey are setting it up, they don’t need to worry about specifying the questions asked in their surveys. Instead, PAPRIKA’s questions are determined in real time adaptively and automatically (via 1000minds’ user-friendly interface).
In contrast, most other conjoint-analysis methods require survey administrators to carefully pre-select – known as “design” – the questions to be asked, with the objective that the resulting “fractional factorial design” is efficient in the sense that the pre-selected questions are capable of accurately revealing each attribute’s relative importance.
Coming up with an efficient design can be complicated. Doing so usually requires additional methods and specialized software to carefully select a small subset of alternatives to be included in the survey questions from the typically many thousands or millions of possible combinations of attributes.
Fortunately, you don’t need to worry about such design issues with PAPRIKA thanks to its adaptivity. Therefore, as well as being scientifically valid and reliable, PAPRIKA is highly practicable and user-friendly.
Your preferences codified
When you have finished answering PAPRIKA’s trade-off questions, the method uses mathematical techniques (based on linear programming) to calculate your “preference values” or “utilities”, also known as “part-worths”. These values represent the relative importance, or weight, of the criteria and their levels to you.
Examples of preference values and utilities for the two earlier examples of prioritizing projects and choosing or designing a car appear in Tables 1 and 2.
| Weight (sum = 1) | Score (0–100) | Preference value | |||
|---|---|---|---|---|---|
| Strategic alignment | |||||
| low | × | 0.0 | = | 0.0% | |
| moderate | 0.377 | × | 10.9 | = | 4.1% |
| high | × | 100.0 | = | 37.7% | |
| Scalability | |||||
| not scalable | × | 0.0 | = | 0.0% | |
| low | 0.333 | × | 14.5 | = | 4.8% |
| moderate | × | 60.9 | = | 20.3% | |
| high | × | 100.0 | = | 33.3% | |
| Innovation | |||||
| none | × | 0.0 | = | 0.0% | |
| very low | × | 58.7 | = | 8.9% | |
| low | 0.152 | × | 81.0 | = | 12.3% |
| moderate | × | 85.7 | = | 13.0% | |
| high | × | 100.0 | = | 15.2% | |
| Environmental impact | |||||
| highly negative | × | 0.0 | = | 0.0% | |
| moderately negative | × | 41.7 | = | 3.6% | |
| neutral | 0.087 | × | 77.8 | = | 6.8% |
| moderately positive | × | 88.9 | = | 7.7% | |
| highly positive | × | 100.0 | = | 8.7% | |
| Completion time | |||||
| long | × | 0.0 | = | 0.0% | |
| medium | 0.051 | × | 90.5 | = | 4.6% |
| short | × | 100.0 | = | 5.1% | |
| Attribute weight (sum = 1) | Score (0-100) | Part-worth utility | |||
|---|---|---|---|---|---|
| Fuel economy | |||||
| below average | × | 0.0 | = | 0.0% | |
| average | 0.383 | × | 83.5 | = | 32.0% |
| above average | × | 100.0 | = | 38.3% | |
| Overall look and aesthetics | |||||
| ugly | × | 0.0 | = | 0.0% | |
| OK | 0.320 | × | 51.9 | = | 16.6% |
| beautiful | × | 100.0 | = | 32.0% | |
| Price | |||||
| $50,000 | × | 0.0 | = | 0.0% | |
| $45,000 | × | 6.7 | = | 1.2% | |
| $40,000 | × | 17.8 | = | 3.2% | |
| $35,000 | 0.178 | × | 37.8 | = | 6.7% |
| $30,000 | × | 93.3 | = | 16.6% | |
| $25,000 | × | 100.0 | = | 17.8% | |
| Engine size (power) | |||||
| small | × | 0.0 | = | 0.0% | |
| medium | 0.095 | × | 62.5 | = | 5.9% |
| large | × | 100.0 | = | 9.5% | |
| Electronics accessories | |||||
| standard | × | 0.0 | = | 0.0% | |
| extras | 0.016 | × | 100.0 | = | 1.6% |
| Safety features | |||||
| standard | × | 0.0 | = | 0.0% | |
| extras | 0.008 | × | 100.0 | = | 0.8% |
Ranked alternatives
Having determined your preference values or utilities, 1000minds automatically applies them to rank any alternatives you are considering according to how they are described on the criteria. An illustration for the project-prioritization example appears in Table 3.
1000minds also applies your preference values or utilities to rank all alternatives that are hypothetically possible – i.e. all combinations of the levels on the criteria – which is useful when many alternatives are to be evaluated over time. For example, in health and education, 1000s of patients or students may need to be prioritized, such as for access to health care or scholarships, on an ongoing basis and in real time.
| Alternative | Rank | Total score | Criterion contribution | Strategic alignment | Completion time | Scalability | Innovation | Environmental impact |
|---|---|---|---|---|---|---|---|---|
| Project E | 1st | 86.0% |
|
high | short | moderate | high | moderately positive |
| Project H | 2nd | 71.7% |
|
high | short | moderate | none | highly positive |
| Project G | 3rd | 66.2% |
|
high | medium | moderate | none | moderately negative |
| Project C | 4th | 61.4% |
|
low | short | high | high | moderately positive |
| Project I | 5th | 57.7% |
|
low | medium | high | moderate | neutral |
| Project F | 6th | 54.3% |
|
high | long | not scalable | very low | moderately positive |
| Project R | 7th | 53.6% |
|
low | short | high | high | highly negative |
| Project A | 8th | 50.0% |
|
low | long | high | very low | moderately positive |
| Project M | 9th | 45.4% |
|
low | short | moderate | low | moderately positive |
| Project O | 10th | 40.3% |
|
moderate | long | moderate | low | moderately negative |
| Project N | 11th | 33.1% |
|
moderate | long | moderate | none | highly positive |
| Project P | 12th | 31.2% |
|
moderate | short | not scalable | high | neutral |
| Project S | 13th | 26.1% |
|
moderate | medium | low | very low | moderately negative |
| Project T | 14th | 20.0% |
|
low | long | low | high | highly negative |
| Project K | 15th | 12.3% |
|
low | long | not scalable | low | highly negative |
Validating and applying your results
Before finalizing your results, it is good practice to consider their face validity by thinking about the plausibility of the relative importance of the criteria implied by their preference values or utilities:
- Do these weights seem about right to you?
- Are you able to reconcile any incongruities?
It’s easy to check the reliability of your answers to PAPRIKA’s questions by re-answering some or all of them. 1000minds’ user-friendliness and PAPRIKA’s adaptivity ensures that any changes to your answers are easy to make and automatically carried through to your results.
Perhaps later, if desired, you can easily revise the criteria and levels without repeating the entire PAPRIKA process. New criteria can be added or obsolete ones deleted without affecting the other criteria. You will only be asked new trade-off questions to calibrate the relative importance of the new criteria vis-a-vis the existing ones.
When you are happy with your results, 1000minds has tools for interpreting, analyzing and applying them in your decision-making or conjoint analysis application.
Decision-making
Most decision-making applications involve ranking, prioritizing or selecting alternatives. 1000minds has powerful tools for comparing alternatives, including sensitivity analysis to evaluate changes in alternatives’ ratings on the criteria and how this affects their ranking.
In addition, some applications, such as investment or project decision-making (e.g. CAPEX), involve allocating budgets or other scarce resources across alternatives with the objective of maximizing “value for money” and efficiency. For such applications, 1000minds also offers a transparent resource-allocation framework.
Conjoint analysis and DCE
Further analyses of the utilities and rankings of the alternatives you are considering are supported by 1000minds, mostly automatically. As illustrated here, these analyses include:
- attribute rankings
- attribute “relative importance” ratios
- market shares
- market simulations based on changes to alternatives’ attributes
- elasticities and demand curves
- marginal willingness-to-pay (MWTP) estimates from the utilities
An important strength of PAPRIKA is that utilities are elicited for each individual participant in a 1000minds conjoint survey. Such individual-level data is suitable for cluster analysis – e.g. using Excel or a statistics package – to identify “clusters”, or “market segments”, of people with similar preferences.
That ends our introduction to 1000minds’ “secret spice”, the PAPRIKA method. If you haven’t done so already, you might like to give PAPRIKA a go now!
If you’re still interested (we hope so!), more detailed information about PAPRIKA is available below.
Want to learn more about PAPRIKA?
The second part of this article is devoted to answering these questions about PAPRIKA:
- Why are PAPRIKA’s trade-off questions the easiest possible for eliciting people’s preferences?
- What limits the number of questions asked so that PAPRIKA is user-friendly?
- How does PAPRIKA compare with other methods for MCDA and conjoint analysis, i.e. the Analytic Hierarchy Process (AHP) and statistical estimation of logit choice models?
- What’s the difference between PAPRIKA and data mining/machine learning?
More technical information about PAPRIKA, including step-by-step demonstrations of the algebra and calculations underpinning the method for a simple example, are available from these peer-reviewed sources:
- A comprehensive overview is available from the Wikipedia article
- For technical information, here is our journal article: P Hansen & F Ombler (2008), “A new method for scoring multi-attribute value models using pairwise rankings of alternatives”, Journal of Multi-Criteria Decision Analysis 15, 87-107
Why are PAPRIKA’s trade-off questions the easiest possible for eliciting people’s preferences?
PAPRIKA’s questions involve the simplest possible trade-offs for people to think about because they are based on just two criteria or attributes at a time, e.g. see Figures 3 and 4 below. This simplicity means that, as well as being quick to answer, you can have confidence in your answers to PAPRIKA’s questions.
Simplest possible trade-offs
Indeed, when you think about it … choosing one alternative from two, where the alternatives are defined on just two criteria at a time, is the easiest question involving a trade-off that you can ever be asked – in all possible universes!
In contrast, choosing one alternative from three or more alternatives is more difficult, as is choosing between alternatives defined on more than two criteria. In general, as the number of alternatives and/or criteria rises when choosing between alternatives, the cognitive difficulty increases because there are increasingly more trade-offs to keep track of and weigh up in each question.
Clearly, two alternatives and two criteria are the minimum possible (with just one alternative or criterion, there is no trade-off to consider and hence no choice to make). Thus, PAPRIKA’s trade-off questions are the simplest possible.
As mentioned earlier, after answering questions with two or three criteria at a time, it is possible with PAPRIKA to go to the “next level of decision-making” by answering questions with three criteria, and then four, etc, up to the number of criteria for your application. However, for most applications, answering questions with just two or three criteria or attributes is usually sufficient for your results to be accurate.
Partial vs full profiles
PAPRIKA’s trade-off questions are based on what are known as “partial profiles”: where the two hypothetical alternatives in each question are defined on just two criteria or attributes at a time (see Figures 3 and 4 again). In effect, the other criteria/attributes for the application are treated as being the same – i.e. “all else being equal” – in each question.
In contrast, most other methods are based on more complex and cognitively difficult trade-off questions involving “full profiles”: where the alternatives you are asked to choose between are defined on all criteria for the application together, e.g. six or more criteria – even, in extreme applications, a dozen or more criteria together!
In conjoint analysis, such questions, whether they involve partial or full profiles, are known as “choice sets” – because they require the participant to make a choice.
To appreciate the complexity and cognitive difficulty of answering full-profile questions (or choice sets), imagine each pair of hypothetical alternatives you are asked to choose between in Figures 3 and 4 has six or more criteria instead of just two, as with PAPRIKA.
How easy would you find answering such full-profile questions? Think about all the comparisons you would have to keep track of across the six or more criteria included in each question.
How much confidence would you have in your answers – in their validity and reliability?
The obvious advantage of PAPRIKA’s simple partial-profile questions – just two criteria at a time (Figures 3 and 4) – is that they are easy to think about so that most people can answer them quickly and with confidence in their answers.
Biases from using full profiles
In the academic literature, full-profile conjoint analysis is known to suffer from biases caused by two heuristics, or mental shortcuts, that most people use when making choices:
- the “prominence effect” (Tversky, Sattath & Slovic 1988; Fischer, Carmon, Ariely & Zauberman 1998)
- “attribute non-attendance” (Hensher, Rose & Greene 2005)
The prominence effect is the phenomenon whereby when choosing between full-profile alternatives (e.g. consumer products) you focus on the attribute that is most important, or “prominent”, to you and choose the alternative with the higher level on that attribute. A common example of a prominent attribute for many people is price, especially for people who are particularly price sensitive.
Similarly, attribute non-attendance is when you ignore one or more of the attributes in the full-profile alternatives you are choosing between – not because you don’t care about these “non-attended attributes” but because you do not understand them (or how they are expressed), or find them too difficult to think about, especially when other attributes are easier to think about.
The prominence effect and attribute non-attendance – i.e. resulting in people unduly fixating on some attributes and ignoring others – undermines the validity of their preferences that are revealed, causing biased conjoint-analysis results or decision-making outcomes.
In contrast, because PAPRIKA’s partial-profile questions only contain two attributes at a time, they are much less prone to these potential sources of bias.
But what about “realism”?
On the other hand, it’s perhaps tempting to criticize PAPRIKA’s partial profiles – in the extreme, just two attributes in each question (choice set) – as being overly-simplistic, unrealistic representations of real-world decision-making.
Such a criticism is spurious, however, because the fundamental purpose of conjoint analysis and Multi-Criteria Decision Analysis (MCDA) respectively is not to replicate real-world decision-making per se. For conjoint analysis, the purpose is to generate valid and reliable data about what matters to people when they make choices, and for MCDA it is to improve decision-making accuracy.
Overall, the superiority of partial-profile questions is confirmed by the research finding that conjoint analysis based on partial profiles more accurately reflects people’s true preferences than full-profile conjoint analysis (Chrzan 2010; Meyerhoff & Oehlmann 2023).
Voting and consensus
Another advantage of PAPRIKA’s trade-off questions is that their simplicity is suited to group decision-making involving people expressing their preferences by voting on the answers to each of the questions, one question at a time.
When there are disagreements in how people voted on a question such that the votes are split – which is entirely natural and to be expected (and celebrated!) – with just two criteria to focus on, the opposing viewpoints can be easily discussed in pursuit of consensus. The process of reaching consensus ensures greater face validity.
It’s usually best practice for voting to be anonymous – though totals can be tallied and recorded – to encourage participants to express their preferences sincerely and without being influenced by how others are voting, thereby avoiding “bandwagon effects” and “herd behavior”.
The following user-friendly voting process is available in 1000minds.
- Participants vote anonymously on each question, one by one, using 1000minds on their own screens (laptops, tablets or smartphones). This applies whether they are collaborating together in the same room or joining remotely via online meeting software. For each question, they simply select the left or the right or “they are equal”.
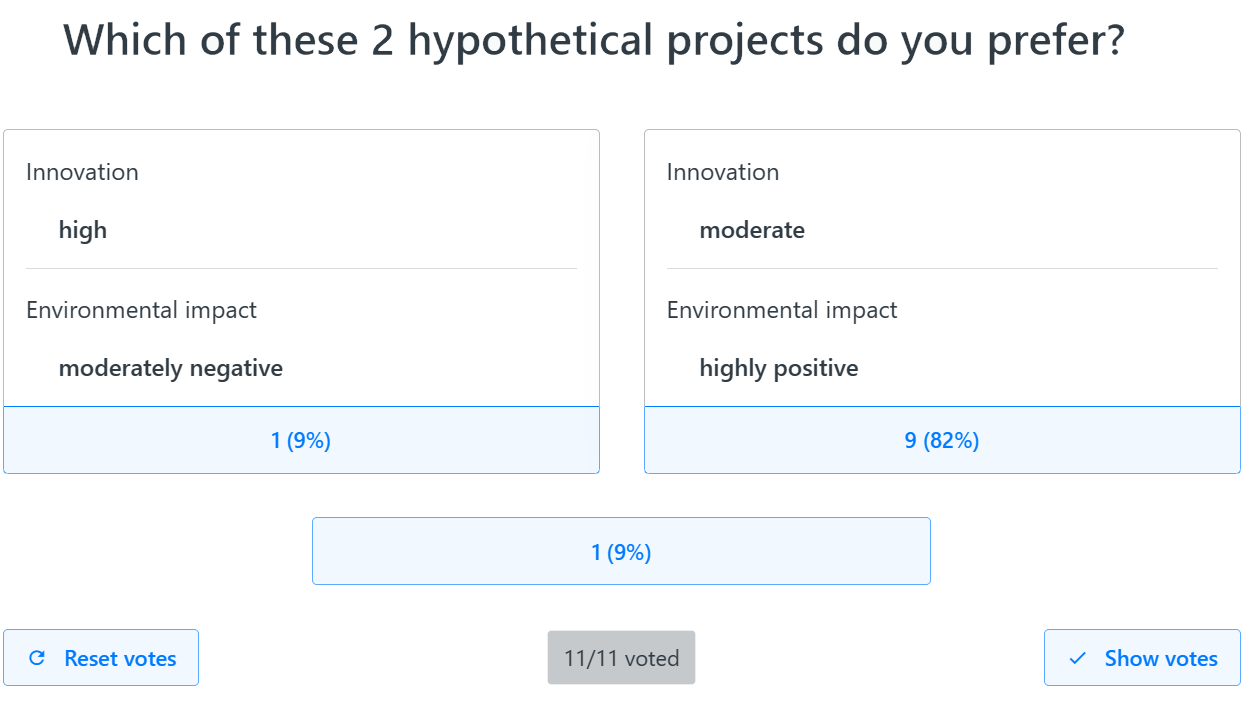
- After each vote, the moderator leading the session clicks the “show votes” button, which reveals on the shared screen how participants voted across the three possible answers; see Figure 5 for an example.
- If there is full agreement (unanimity), the moderator clicks the corresponding choice on the shared screen, and then the next question to be voted on appears on everyone’s screens.
- If the vote is not unanimous, this can be handled in several possible ways, such as: with just one dissenter, they can either accept the majority vote or join in a group discussion in pursuit of consensus; with more dissenters, there can be discussion and consensus and re-voting (“reset votes” in Figure 5). On the rare occasions when consensus cannot be reached or there are too many participants for consensus-building to be practicable, the final decision can be reached via a majority decision.
- This process is repeated until all questions have been voted on and potentially discussed by the group.
For most participants, the voting process is engaging and enjoyable overall, as well as being great for team-building.
In addition to voting, 1000minds has a suite of survey-based tools for group decision-making involving potentially 1000s of people. 1000minds supports the Delphi method, a consensus-based decision-making framework involving repeated rounds of surveys and reflection by a group or panel of experts.
Ordinal to interval data: lead into gold!
We now briefly turn our attention to some of the foundational theoretical aspects of the PAPRIKA method.
When you are answering its trade-off questions, PAPRIKA is getting you to make ordinal, or ranking, judgments – i.e. which hypothetical alternative do you prefer or are they equal?
From your answers to these simplest of questions, PAPRIKA calculates your preference values or utilities to not only rank alternatives but also to score them on an interval scale – e.g. like temperature scales, such as Celsius or Fahrenheit, or time of day (Stevens 1946).
How is this remarkable alchemy – transforming ordinal data into interval data – accomplished?
Based on your ordinal judgments, PAPRIKA is able to generate preference values and scores with interval scale properties because it is arguably the most successful pure application of the theory of conjoint measurement (Luce & Tukey 1964; Debreu 1959).
Your ordinal judgments are conjoint measurements: you are repeatedly comparing combinations of differences between levels on multiple criteria, and the more such conjoint measurements you perform, the less “wiggle room” there is in the universe of possible preference values consistent with your preferences (your measurements).
In general, the more trade-offs you make, the more certain you can be that the resulting preference values and scores of alternatives reflect your preferences. To understand this further when using 1000minds, you should pay attention to the accuracy indicator and the “possible range” of scores reported inside the software.
If desired, you can even turn gold into platinum with 1000minds’ scaling tools – allowing you to score alternatives on a ratio scale, e.g. to be able to say one alternative is, say, 3-times better than another. This capability is especially important when combining scores with other measures like cost in value-for-money analysis.
What limits the number of questions asked so that PAPRIKA is user-friendly?
Each time you answer a trade-off question – i.e. choose between two hypothetical alternatives, such as “projects” or “cars”, as in Figures 3 and 4 above – PAPRIKA immediately identifies and eliminates from further consideration all other pairs of hypothetical alternatives whose rankings are logically implied by your current answer and all your earlier answers.
These eliminated pairs of hypothetical alternatives correspond to possible trade-off questions that you could potentially be asked. But because PAPRIKA knows how they are answered from your earlier answers, they can be dispensed with so that you are not burdened by unnecessary questions.
Adaptive questioning
These eliminated questions are identified adaptively – by PAPRIKA’s exploitation of the mathematical and hence logical properties of additive “multi-criteria value models” that the method is based on. These properties are discussed in the next section.
As well as eliminating questions that you would otherwise unnecessarily be asked, each time you answer a question, PAPRIKA carefully selects the next question to ask you. PAPRIKA’s selection is on the basis that the question it chooses is likely, when you answer it, to eliminate the most possible questions in the future as the process continues. The objective is to minimize the number of questions you are asked so that the method is as practicable and user-friendly as possible.
Again, based on your answer to that next question, all other possible questions that are logically implied by your current answer and all your earlier answers are identified and eliminated, and another question is carefully selected for you to answer next.
This process for identifying possible questions for elimination and new questions for you to answer is repeated until all possible trade-off questions have been either eliminated (the vast majority) or answered by you (a tiny minority).
Properties of additive multi-criteria value models
As discussed above, the possible questions you could be asked but that are eliminated as you answer PAPRIKA’s questions are adaptively identified by the method’s clever exploitation on a very large scale of the mathematical and hence logical properties of additive “multi-criteria value models”.
(As explained in an earlier section of this article, like most methods for decision-making and conjoint analysis, PAPRIKA is based on what are known in the academic literature as additive “multi-criteria value models” or “multi-attribute value models” – also commonly referred to as “weighted-sum”, “additive”, “linear”, “scoring”, “point-count” or “points” models or systems.)
These mathematical/logical properties go by the names of “transitivity”, “monotonicity”, “joint-factor independence” and “double cancellation” (Krantz 1972). Explaining how they are operationalized in 1000minds is outside the scope of this article; for details, see Hansen & Ombler (2008).
Transitivity
The transitivity property is easily illustrated via this simplest of possible examples, intended to give you a sense of how the property works and its implications:
- Imagine that you are asked to rank alternative
Xrelative toY(where these two alternatives are defined on two criteria like the trade-off questions in Figures 3 and 4 above). You chooseX. - Later, you are asked to rank
Yversus a third alternative,Z. You chooseY. - Therefore, given you ranked
Xahead ofYandYahead ofZ, then logically – by transitivity! –Xmust be ranked ahead ofZ.
And so PAPRIKA would implicitly rank this third pair of alternatives (X versus Z) and eliminate the corresponding question that you could potentially have been asked. Because PAPRIKA already knows the answer to this question thanks to your two earlier answers, you will not be asked to answer it unnecessarily.
Transitivity is a desirable property because it ensures your decisions are internally consistent, meaning your preferences are coherent and stable, as required for so-called “rational” decision-making. If you prefer option X over Y and Y over Z, then consistency requires that you also prefer X over Z.
Without transitivity, your preferences become cyclical and contradictory – e.g. preferring X over Y, Y over Z, but Z over X. Such an intransitive set of preferences makes it impossible to form a definitive ranking of options. Instead, your rankings will go round in circles, making it difficult to justify or reliably act on your choices.
A powerful adaptive algorithm
The transitivity example above is extremely simple relative to PAPRIKA applications, which typically involve very large numbers of possible questions and hypothetical alternatives. PAPRIKA applies transitivity, and the other properties of additive “multi-criteria value models” mentioned above, across many dimensions simultaneously on a very large scale while optimizing the sequence of questions each decision-maker is asked.
This large-scale multi-dimensionality dramatically increases PAPRIKA’s computational complexity. Moreover, the computations must be performed in real time as the questions are answered one by one without making decision-makers wait between questions.
Thus, each time you answer a trade-off question, 1000minds pauses for a split second to, in effect, “think” about two important issues:
- Which of the other possible questions to eliminate (because their answers are implied by your answers to earlier questions)?
- Which of the remaining questions is the best to ask you next?
PAPRIKA continually adapts as you answer the trade-off questions to ensure that the number of questions is minimized. And yet by answering a relatively small number of questions you end up having pairwise ranked all hypothetical alternatives differentiated on two criteria at a time, either explicitly or implicitly.
PAPRIKA guarantees that your pairwise rankings – answers to the trade-off questions – are consistent, and thus a complete overall ranking of all hypothetically possible alternatives representable by the criteria is determined, based on your preferences.
Finally, from your pairwise rankings, your preferences are accurately codified as the preference values or utilities generated by PAPRIKA, which are used to rank any alternatives you are considering.
Eureka!
As implemented in 1000minds, PAPRIKA achieves the remarkable feat – hence, its many patents and awards – of keeping track of all the potentially millions of pairwise rankings of all hypothetically possible alternatives implied by each decision-maker’s answers to the trade-off questions.
In other words, PAPRIKA identifies Potentially All Pairwise RanKings of all possible Alternatives representable by the criteria for your application; hence, the acronym for the method’s full name: PAPRIKA.
PAPRIKA keeps track of all these pairwise rankings efficiently and in real time, ensuring the number of questions you are asked is minimized so that the method is as practicable and user-friendly as possible.
Technical details are available in Hansen and Ombler (2008), including a step-by-step demonstration of the algebra and calculations underpinning PAPRIKA for a simple example involving three criteria with two levels each.
How many questions and how long do they take?
The number of trade-off questions you are asked depends on how many criteria and levels you specified for your application: the more criteria and/or levels, the more questions.
For most applications, fewer than a dozen criteria is usually sufficient, though more are possible and 4 to 8 is fairly typical.
With respect to the criteria’s levels, there is usually no requirement that the criteria have the same number of levels each, e.g. some can have three levels, others four, five, etc – whatever is appropriate for your application.
If you had, for example, four criteria and three or four levels each, you would be asked approximately 25 questions; with six criteria, ~42 questions; with eight criteria, ~60 questions, etc.
Because PAPRIKA’s questions are the easiest possible involving trade-offs, they are quick to answer. For example, most participants in 1000minds preferences surveys and DCEs can comfortably answer 4 to 6 questions per minute.
And so, for the three examples above:
- 4 criteria and 3 or 4 levels each: ~25 questions, taking less than 10 minutes for most people
- 6 criteria and 3 or 4 levels each: ~42 questions, taking less than 15 minutes
- 8 criteria and 3 or 4 levels each: ~60 questions, taking less than 20 minutes
Thus, in addition to being scientifically valid and reliable, PAPRIKA is highly practicable and user-friendly.
It’s also worthwhile noting that, for obvious reasons, the time required to answer PAPRIKA’s questions depends on the length and intricacy of the language used for the criteria and levels: the shorter and simpler, the better. Decision-makers’ expertise and how engaged they are also matters, as well as the application’s overall complexity.
Also, it typically takes longer if you use 1000minds’ voting option for groups to answer the questions by voting on them one question at a time and discuss disagreements in pursuit of consensus. On the other hand, it is usually a highly productive and enjoyable team-building exercise!
Path dependency
The numbers of trade-off questions asked by PAPRIKA reported above for the three examples of applications with four, six and eight criteria respectively were approximate estimates rather than precise statistics: ~25, ~42 and ~60 questions respectively.
This imprecision is because the number of questions you are asked depends on how you answer them. And so, because of PAPRIKA’s adaptivity, the questions exhibit “path dependency” – which, in the present context, means that if you were to answer the questions differently, you would be asked different questions, typically resulting in different numbers of questions each time.
Likewise, when groups of people are individually faced with the same set of possible questions, as for a 1000minds preferences survey, because people’s preferences are likely to be idiosyncratic, they will answer at least some of their questions differently. Hence, they are likely to answer different numbers of questions each.
Another transitivity illustration
This phenomenon of path dependency is easily illustrated by returning to the earlier simple example used to illustrate the logical property of transitivity and asking a second person the same questions asked of the first person in the earlier example:
- Imagine that the second person answers the first question,
XversusY, the same as the first person:Xahead ofY. - But they answer the second question,
YversusZ, the opposite to the first person’s ranking:Zahead ofY. - This time, given that this second person ranked
Xahead ofYandZahead ofY, we know nothing about how they would rankXversusZ. Therefore, they would need to be asked this third question.
Thus, in this second transitivity example, the second person would be asked all three trade-off questions instead of just the two asked of the first person in the first example.
To help you decide how many criteria and levels to specify for your application, 1000minds provides a useful simulation tool for estimating how many questions will be asked.
An example of the simulation results based on six criteria and three or four levels each appears in Figure 6: thus, you could expect to be asked 42 questions on average, based on 14 simulations ranging from a minimum of 30 questions to a maximum of 60.
Given most people can comfortably answer 4 to 6 questions per minute, most people should be able to answer these 30 to 60 questions in under 15 minutes.

How does PAPRIKA compare with other methods for MCDA and conjoint analysis?
Decision-making and conjoint analysis are large methodological fields with long and illustrious histories and myriad applications in business, nonprofits, government and academia. Unsurprisingly, therefore, in addition to PAPRIKA, other methods for determining people’s preference values or utilities, representing the relative importance of criteria or attributes, are available, of which the two most prominent examples are:
- The Analytic Hierarchy Process (AHP) – used for Multi-Criteria Decision Analysis (MCDA)
- Statistical estimation of logit choice models – mostly for conjoint analysis
These methods are briefly explained in turn below and compared to PAPRIKA (so that you can have confidence in choosing PAPRIKA!).
The Analytic Hierarchy Process (AHP)
Invented by Thomas Saaty (Saaty 1977, 1980), the Analytic Hierarchy Process (AHP) is based on decision-makers directly expressing how they feel about the relative importance of one criterion versus another on a nine-point scale, thereby generating what are known as ratio-scale measurements of people’s preferences.
Here is a generic example of an AHP ratio-scale question:
On a scale from 1 to 9 (see below), how much more important – or preferred – is criterionAthan criterionB?
Such a question with specific criteria for prioritizing an organization’s projects would be:
On a scale from 1 to 9, when prioritizing projects how much more important is “strategic alignment” than “innovation potential”?
Here is the nine-point scale with AHP’s descriptions of the intensity of preferences accompanying each ratio value:
- Equally important (or preferred)
- Equally to moderately more important
- Moderately more important
- Moderately to strongly more important
- Strongly more important
- Strongly to very strongly more important
- Very strongly more important
- Very strongly to extremely more important
- Extremely more important
For example, if the decision-maker answered “7” to either of the questions above, this is interpreted as meaning the first criterion is 7-times as important as the second criterion, equivalent to “very strongly more important”.
Alternatively, if the decision-maker thinks the first criterion is less important than the second criterion, its relative importance corresponds to reciprocals of the ratios above: 1, 1/2, 1/3, 1/4, 1/4, 1/5, 1/7, 1/8 or 1/9 – e.g. where “1/7” means the first criterion is 1/7th as important as the second criterion, i.e. “very strongly unimportant”.
Analogous ratio-scale questions are used to elicit how the decision-maker feels about the relative performance of any alternatives being considered on each criterion, such as:
With respect to criterionA, on a scale from 1 to 9, how much more important – or preferred – is alternativeXthan alternativeY?
For example, if the person answers “5”, this means alternative X is 5-times more important (or preferred) on criterion A than alternative Y, i.e. “strongly more important”.
Finally, from the ratio-scale measurements for the criteria and alternatives respectively – and after some intricate calculations usually performed using Excel or specialized software – the criteria weights and relative performance of the alternatives are quantified and the alternatives ranked.
AHP’s weaknesses
AHP’s weaknesses have been extensively documented in the academic literature – e.g. Belton & Gear (1983), French (1986), Belton & Stewart (2002) and Munier & Hontoria (2021). Many of these weaknesses are technical in nature and outside the scope of this article about PAPRIKA.
The following three well-known weaknesses, which are relatively easily explained, are most relevant to comparing PAPRIKA with AHP in the next section.
- The cognitive difficulty of answering AHP’s ratio-scale questions
- The arbitrariness of AHP’s nine-point ratio scale
- Rank reversals of alternatives
The cognitive difficulty of answering AHP’s ratio-scale questions
Most people find answering AHP’s ratio-scale questions cognitively difficult, requiring a fair amount of mental effort and resulting in answers of questionable validity and reliability.
This cognitive difficulty is because thinking about how strongly you feel about one criterion, or alternative, relative to another and expressing that intensity on a 0 to 9 scale, even with verbal equivalents, is an unnatural decision-making activity that most of us have little experience of in our lives.
For example, how confident would you be in the accuracy (validity) of your answers to the illustrative AHP ratio-scale questions above?
Also, do you think that if you were asked the same questions a month later, your answers would be the same or even close, i.e. are your answers reliable?
Therefore, as a method for determining people’s preference values or utilities, it’s easy to question AHP’s validity and reliability – i.e. “garbage in, garbage out”.
The arbitrariness of AHP’s nine-point ratio scale
Fundamental to AHP is its ratio-scale questions. Two obvious criticisms about the arbitrariness of AHP’s nine-point scale and associated descriptions of the intensity of people’s preferences are implied by these two questions:
- Why these particular descriptions for each of the points on the scale and not other descriptions instead, and what is the theoretical foundation for equating the 1 to 9 ratio scale with them?
- Why is AHP’s maximum ratio-scale value equal to 9 (i.e. the first criterion is 9-times as important as the second) and not some other – higher or lower – arbitrary maximum?
Related to the second question, another issue is illustrated by the following simple example.
Suppose criterion (or alternative) A is 5-times as important as criterion B, and B is 5-times as important as criterion C. These two ratios imply that criterion A is 25-times (i.e. 5×5) as important as C.
But if you were asked about how you felt about A relative to C, such an answer (25-times) is impossible because the maximum value on AHP’s ratio scale is 9 (9-times).
In the extreme, if the first two links in this simple logical chain of transitivity were 9-times as important, then the third link should be 81-times! AHP does not permit ratios above 9 – virtually guaranteeing inconsistencies in decision-makers’ pairwise comparisons.
Rank reversals of alternatives
“Rank reversal” is the phenomenon whereby a new alternative introduced to an AHP application, despite this new alternative not affecting any of the original alternatives in the application, causes a change in the ranking of the original alternatives: a rank reversal! (Belton & Gear 1983).
(Rank reversal is sometimes referred to as a violation of a fundamental axiom of rational decision-making known as “the independence of irrelevant alternatives”, or IIA.)
For example, if you used AHP to arrive at a ranking of three alternatives, the subsequent addition of a fourth alternative could change how the original three alternatives were ranked. Such a rank reversal would likely undermine most people’s confidence in their AHP results.
How does PAPRIKA compare with AHP?
In short, PAPRIKA does not have AHP’s weaknesses above.
In contrast to AHP’s ratio-scale questions, PAPRIKA’s defining characteristic from a user’s perspective is that it is based on simple pairwise rankings of alternatives usually defined on just two criteria at a time – e.g. see Figures 7 and 8.
Most people find answering PAPRIKA’s pairwise-ranking questions easier than AHP’s ratio-scale questions (albeit answering PAPRIKA’s questions still requires mental effort, of course).
Easiest choices possible
PAPRIKA’s advantage is that pairwise ranking – choosing one alternative from two – is the easiest type of choice possible. Such choices are a natural mental activity that we engage in dozens if not hundreds of times daily, such as: “would you like scrambled or poached eggs for breakfast?”, “shall we go out to a movie or stay in and watch Netflix?”, etc.
In the words of Drummond et al. (2015):
The advantage of choice-based methods is that choosing, unlike scaling, is a natural human task at which we all have considerable experience, and furthermore it is observable and verifiable.
In summary, PAPRIKA involves simple ordinal, or ranking, measurements of decision-makers’ preferences, which are easier and more natural than AHP’s more challenging ratio-scale measurements. PAPRIKA is as cognitively simple and user-friendly as possible, as well as scientifically valid and reliable.
Therefore, you can have more confidence in using PAPRIKA and hence in decisions reached with the help of 1000minds.
Statistical estimation of logit choice models
Another popular method for determining people’s preference values or utilities is the statistical estimation of what are known as “logit choice models”, such as multinomial or conditional logit, as developed by Daniel McFadden (McFadden 1974). This approach is mostly used for conjoint analysis and not decision-making (though, in principle, it could be).
Logit choice models, which are also used for predictive modelling in other areas such as weather forecasting and economic modelling, are technically complicated and their details are beyond the scope of this article (e.g. see Train 2009). The estimation of such models in the present context of conjoint analysis can be summarized as follows.
Underpinned by Random Utility Theory (RUT), logit choice models are based on modeling the probability of each alternative included in a conjoint analysis being chosen relative to other alternatives that participants could have chosen instead. The higher an alternative’s “utility” – its value or desirability – the more likely it is to be chosen.
From people’s choices, their utilities are derived by estimating the relationship between alternatives’ attributes and their probability of being chosen. A logistic mathematical function converts these utilities into probabilities, ensuring they lie between 0 and 1, which allows the effect of changes in attributes on the likelihood of being chosen to be interpreted.
Hierarchical Bayes and “shrinkage”
Hierarchical Bayes (HB) estimation methods are now widely used, enabling utilities to be inferred at the individual level while pooling information across participants.
This pooling introduces what is known as “shrinkage”, meaning that each person’s estimated utilities are gently pulled toward the average pattern in the sample.
The effect of shrinkage is to stabilize the individual-level utility estimates given each participant in a conjoint analysis based on this approach provides only a limited amount of data (e.g. their choices), reducing the influence of random or inconsistent responses. The less data there is for an individual, the more their utilities are pulled toward the group average.
How does PAPRIKA compare with statistical estimation of logit choice models?
PAPRIKA is based on a different method for determining preference values or utilities. Instead of statistical estimation, PAPRIKA uses linear programming to calculate each participant’s utilities from their pairwise rankings across their personal choice sets.
PAPRIKA treats each person’s dataset of pairwise rankings as a system of linear inequations and equalities – inequalities for strict preferences (e.g. “This one” in Figures 7 and 8 above) and equalities for indifference (“They are equal”) – consistent with an additive utility model used in conjoint analysis.
The adaptive nature of PAPRIKA discussed earlier (based on the properties of additive utility models) ensures each participant’s inequalities and equalities are logically consistent and the number in each system is minimized.
From each participant’s system of inequalities/equalities, their utilities are determined using linear programming by solving for the weights satisfying the pairwise rankings, and where, mathematically speaking, the weights are located at the “Chebyshev center”. These weights are normalized as utilities for each attribute level. Technical details are available in Hansen and Ombler (2008).
Implemented by 1000minds, PAPRIKA generates utilities automatically and in real time. This user-friendliness and speed is an important practical advantage compared to statistical estimation, which typically requires additional time for processing and expert support from skillful statisticians.
PAPRIKA’s individual-level data
Another important advantage of PAPRIKA is that it generates utilities for each participant independently of all others in the sample recruited for the conjoint survey. Each participant’s utilities are derived solely from their own choices and therefore stand on their own, unaffected by other participants and the sample’s size or composition.
In contrast, the hierarchical Bayes methods for estimating logit choice models mentioned earlier derive individual-level utilities by partially pooling information across participants, so that each person’s utilities are influenced by the preferences of other people in the sample.
Therefore, PAPRIKA’s individual-level utilities are suited for granular, micro-focussed subsequent analyses, such as cluster analysis and market simulations.
Cluster analysis
Cluster analysis is a statistical and machine-learning technique performed using Excel or statistics packages (e.g. R, SPSS, Stata, MATLAB) to group, in the present context, participants into clusters, or market segments. Members of the same cluster are more similar to each other with respect to their preferences as captured by their utilities than to members of other clusters.
Further analysis – e.g. multinomial logit regression analysis – can investigate the extent to which participants’ likelihoods of belonging to a particular cluster or market segment are related to their socio-demographic and background characteristic (also collectible in 1000minds surveys). Such information is useful, for example, for designing marketing campaigns for business applications or government policy-making.
Market simulations
PAPRIKA’s individual-level data also enables market simulations from inside 1000minds, e.g. for consumer products such as smartphones, electric vehicles, etc.
To perform a simulation, all you need to do is change any of the products’ ratings on the attributes and see what happens to their market shares, i.e. compare their shares before and after your changes.
Such before-and-after evaluations (i.e. comparative statics) are useful for:
- Head-to-head comparisons: create competing alternative profiles on the attributes and see how each performs – e.g. how might the performance of a product that’s not currently the “market leader” be improved to become the leader?
- Imaginary product testing: before launching a new product, test different configurations in the simulator to predict uptake.
- “What-if” analysis: simulate what happens if a competitor were to reduce their price or add a premium feature.
Simulate your conjoint-survey participants’ choices and find out!
PAPRIKA’s conjoint analysis has no “design” issues
An important practical drawback of most methods for determining preference values or utilities based on statistical estimation (instead of PAPRIKA) is that they require the careful pre-selection, or “design”, of the questions (i.e. “choice sets”) to be included in the conjoint survey.
Because the number of possible choice sets available increases exponentially – potentially in the thousands or millions – with the number of attributes and levels, it is impossible to include more than a very small proportion in a survey. Hence, an important technical issue for most methods other than PAPRIKA is deciding which choice sets to include.
This selection process involves carefully choosing a small but informative subset of the possible choice sets, and is known as “fractional factorial design” (in contrast to “full factorial design”). The objective is to keep the survey short and manageable for participants while including sufficient choice sets – carefully chosen ones! – to allow the relative importance of each attribute to be estimated accurately.
In addition, participants are usually divided into sub-samples and presented with their own common block of choice sets. These blocks across sub-samples are intended to be complementary by efficiently spanning the entire space of possible choice sets – known as efficient fractional factorial design.
Coming up with an efficient fractional factorial design usually requires specialized methods and software – and considerable care – which imposes another layer of complexity to using conjoint-analysis methods other than PAPRIKA.
Fortunately, you don’t need to worry about such design issues with PAPRIKA. Instead, people’s preferences are elicited adaptively and interactively – and automatically – by asking the minimum number of trade-off questions required to pairwise rank all hypothetical alternatives defined on two attributes at a time (either explicitly or implicitly).
This result is where the PAPRIKA method’s name comes from. PAPRIKA is an acronym for the method’s full name: Potentially All Pairwise RanKings of all possible Alternatives – i.e. PAPRIKA results in the identification of “potentially all pairwise rankings of all possible alternatives”.
In conclusion, as well as being user-friendly for participants, conjoint surveys based on PAPRIKA are very easy for administrators to set up.
See also
Wikipedia article about PAPRIKA method
Journal article about PAPRIKA method
References
-
K Chrzan (2010), “Using partial profile choice experiments to handle large numbers of attributes”, International Journal of Market Research 52, 827-40
-
G Debreu (1959), “Topological methods in cardinal utility theory”, Cowles Foundation Discussion Papers, 76
-
M Drummond, M Sculpher, G Torrance, B O’Brien & G Stoddart (2015), Methods for the Economic Evaluation of Health Care Programmes, Oxford University Press
-
G Fischer, Z Carmon, D Ariely & G Zauberman (1998), “Goal-based construction of preferences: task goals and the prominence effect”, Management Science 45, 1057-75
-
P Hansen & F Ombler (2008), “A new method for scoring multi-attribute value models using pairwise rankings of alternatives”, Journal of Multi-Criteria Decision Analysis 15, 87-107
-
R Hastie & R Dawes (2010), Rational Choice in an Uncertain World. The Psychology of Judgment and Decision Making, Sage Publications
-
D Hensher, J Rose & W Greene (2005), “The implications on willingness to pay of respondents ignoring specific attributes”, Transportation 32, 203-22
-
D Kahneman (2011), Thinking, Fast and Slow, Farrar, Straus and Giroux
-
D Kahneman, O Sibony & O Sunstein (2021), Noise: A Flaw in Human Judgment, Little, Brown Spark
-
D Krantz (1972), “Measurement structures and psychological laws”, Science 175, 1427-35
-
R Luce & J Tukey (1964), “Simultaneous conjoint measurement: A new type of fundamental measurement”, Journal of Mathematical Psychology 1, 1-27
-
J Meyerhoff & M Oehlmann (2023), “The performance of full versus partial profile choice set designs in environmental valuation”, Ecological Economics 204, 107665
-
T Saaty (1977), “A scaling method for priorities in hierarchical structures”, Journal of Mathematical Psychology 15, 234-81
-
T Saaty (1980), The Analytic Hierarchy Process: Planning, Priority Setting, Resource Allocation”, McGraw-Hill
-
S Stevens (1946), “On the theory of scales of measurement”, Science 103, 677-80
-
K Train (2009), Discrete Choice Methods with Simulation, Cambridge University Press
-
A Tversky, S Sattath & P Slovic (1988), “Contingent weighting in judgment and choice”, Psychological Review 95, 371-84
-
D McFadden (1974), “Conditional logit analysis of qualitative choice behavior”, Chapter 4 in: P Zarembka (editor), Frontiers in Econometrics, Academic Press